New York American College of Emergency Physicians

Laura Melville, MD MS

Laura Melville, MD MS

Associate Research Director SAFE Medical Director NewYork-Presbyterian Brooklyn Methodist Hospital Chair, New York Research Committee

Joely Merriman, MD Research Fellow

Joely Merriman, MD Research Fellow

Department of Emergency Medicine University of Rochester Medical Center

John DeAngelis, MD FACEP Assistant Professor

John DeAngelis, MD FACEP Assistant Professor

Department of Emergency Medicine University of Rochester Medical Center

Courtney Marie Cora Jones, PhD MPH Associate Professor

Courtney Marie Cora Jones, PhD MPH Associate Professor

Department of Emergency Medicine University of Rochester Medical Center

The Power and Utility of Geospatial Mapping Techniques in Emergency Medicine Research

Preventative medicine and emergency medicine appear to make strange bedfellows and yet they are uniquely equipped to leverage one another. The Emergency Department (ED) does not only serve as a last resort for the end stages of care or exacerbations in unstable disease processes; but more often, for reasons of convenience or finances, as an access portal for primary care, routine work ups, or even basic human needs such as safe shelter and food.1 Many of these lower-acuity services are sought by marginalized patients of lower socioeconomic status. In one Canadian study, they found that “More than 25% of ED visits in Ontario were from the most deprived population.”2 Due to this, researchers, governments and public welfare groups are increasingly utilizing the ED as an access point for these difficult to reach, vulnerable populations (e.g. for broad HIV testing, vaccination, cancer screening, primary care referrals etc.).3 While these initiatives are designed for holistic population benefit, in practice they often provide services that, while valuable, do not directly address the chief complaints prompting patients’ ED presentations.

The writers of this article posit there is value in adopting geospatial mapping techniques for use in Emergency Medicine research as one means to mitigate the upstream contributors of the disease processes managed by ED physicians. Broadly conceptualized, geospatial research and mapping looks at relationships between a characteristic or outcome and physical location. We assert that Emergency Medicine has clinical and public data and technological resources at its disposal to become a leader in geospatial research techniques to benefit the communities they serve, other medical specialties and themselves. The implementation of these techniques is straightforward and benefits from readily available public data.

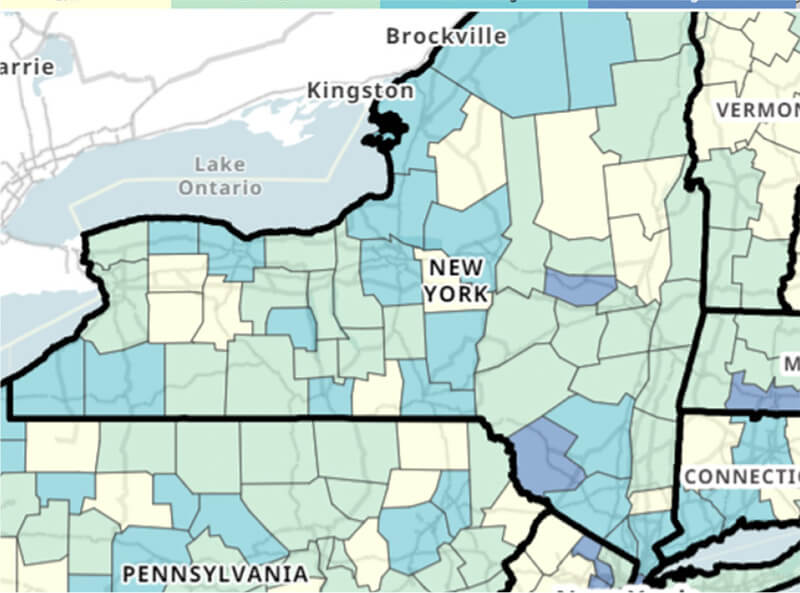
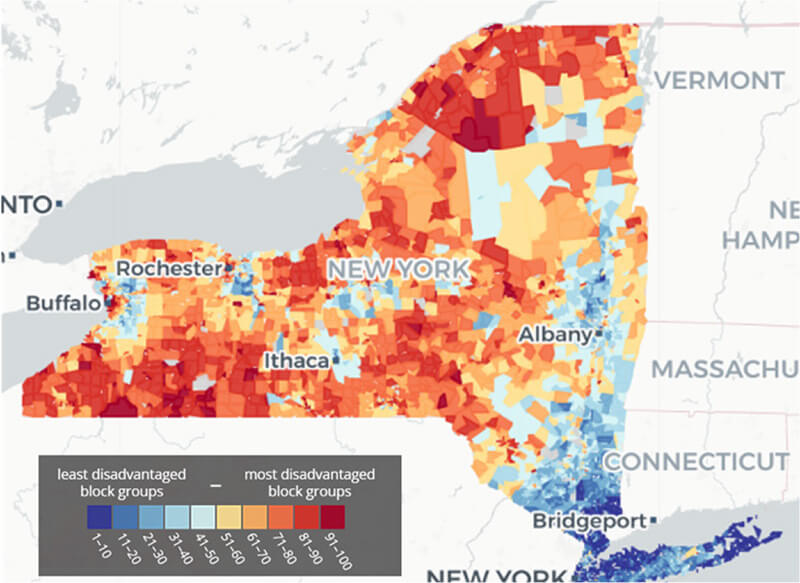
The development of geospatial technologies and frameworks for their application has taken place within commercial industry and institutions of urban and regional planning, government and public health for over two decades. However, until recently the use of geospatial methodologies to elucidate links between health outcomes and their environments had remained largely in the realm of the theoretical due to a lack of original, local data sets. The advent of widely implemented electronic health record (EHR) systems has led to the regular documentation of descriptive data stored in an easily retrievable context, data such as chief complaints, diagnoses at time of admission and discharge and local clinical outcomes across cities and regions.4 Contemporaneously, there has been the development of publically available, well-vetted metrics derived from government population data. Two examples of this are the Social Vulnerability Index (SVI)5 (Figure 1), which identifies communities at risk during disasters, and the Area Deprivation Index (ADI)6 (Figure 2), which identifies disadvantaged neighborhoods. Both of these tools provide quantitative estimates of a neighborhood’s vulnerability in the form of percentile scores or deciles using the state or nation as a relative comparison. Combining the publicly available data with EHR information from the ED allows for relevant clinical, demographic and geographic data to be superimposed on mapping software to generate and respond to research and clinical questions. These two measures of neighborhood-level disadvantage can be linked to geospatial mapping software, such as ArcGIS, to understand the distribution of injury and illness in a given geographic area.

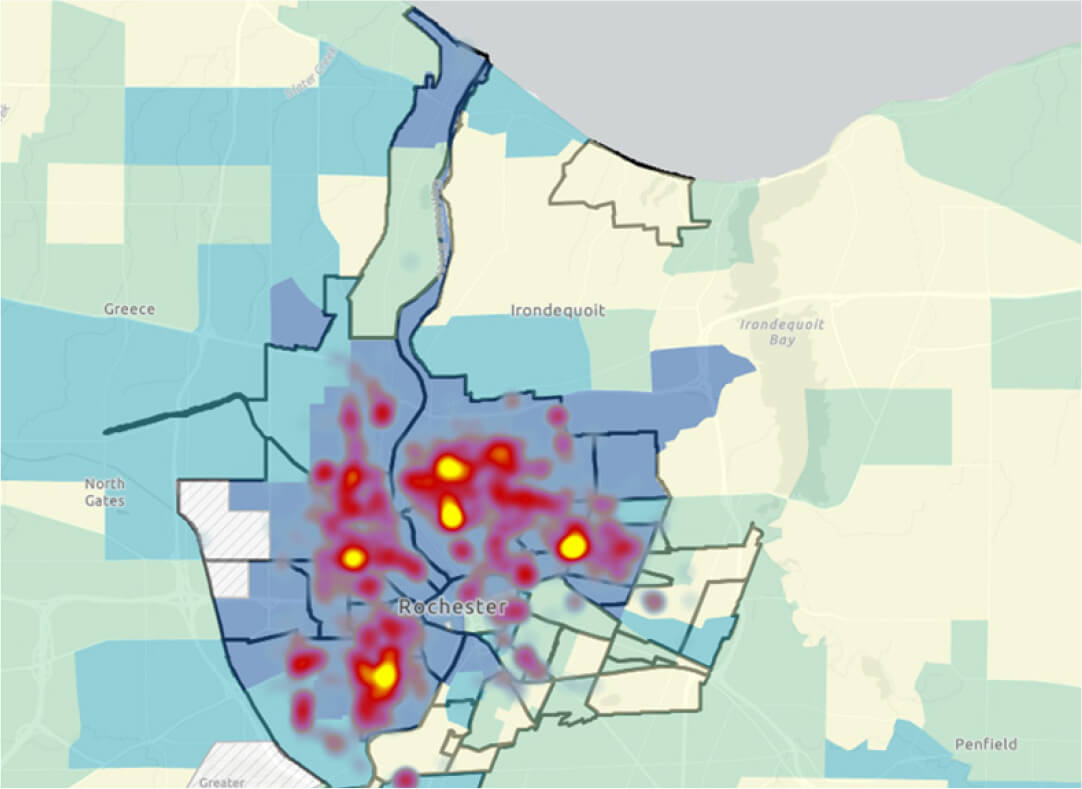
Geospatial techniques lend themselves well to readily understandable presentations of data, such as “heat mapping.” An example of a heat map of publicly available data from the city of Rochester on shooting victims7

(Figure 3) demonstrates how these data sets can quickly be transformed into researchable information on topics germane to the ED. When combined with the data available from an ED EHR, one can easily start to see the power of these techniques to show important associations between health outcomes and public policy issues. The breadth of data relevant to the ED that can be represented in this way is immense, encompassing such differing topics as access to care, social determinants of health, acute injuries and trauma, successful (or unsuccessful) management of chronic medical diseases, etc.. Heat maps are easily interpretable by the general public and policymakers, which helps physicians to direct policy and resources at a state and national level. The power of this kind of representation in advocacy should not be understated.

A local example of recent geospatial-driven research from our institution focuses on mapping out-of-hospital cardiac arrest (OHCA) to identify areas of higher community vulnerability. Using a combination of the techniques described above, the researchers were able to demonstrate associations between OHCA and communities with significantly higher SVI and ADI metrics. This kind of data mapping would, in theory, allow EMS agencies to distribute resources according to the frequency of cardiac arrests in the areas they cover. Furthermore, on a larger scale, state and local agencies can begin to address the underlying socioeconomic causes that are correlated with the increase in morbidity of these geographic areas, thus providing an opportunity to further assess health disparities on the basis of neighborhood.

Geospatial driven research holds additional potential in the current climate of massive volumes and overcrowding in EDs across the country. While the ED is, in many respects, a “laboratory of public health,”8 there are significant limitations to how much the ED can provide when its spatial and human resources for the critically ill patients it was designed to manage are stretched thin. Outside of emergency care, managing how best to apply resources to the public, both in the department and in the community, is paramount. Geospatial mapping identifying neighborhoods with frequent low-acuity visits, for example, could direct the placement of an accessible walk-in clinic or urgent care. This results in multiple benefits, including diverting flows of people with lesser acuity away from EDs, decompressing waiting rooms and potentially freeing up both hospital resources and EMS transportation for patients with higher acuity needs. This is a basic example of the application of geospatial techniques to guide upstream changes in patient flow as well as management of ED resources, but the possibilities of geospatial-driven research in this area are numerous.

Much as Emergency Medicine is uniquely poised to respond to acute illness, it also possesses unique data that, with the new tools of geospatial research methodologies and software, can lead efforts in prevention. By projecting real world outcomes data from the ED out into the community through geospatial techniques, we can begin to look for correlations among the changes at play in policy, environment and society, with actual concrete outcomes data. Geospatial-driven research initiatives hold the potential to be an effective means of improving clinical outcomes, guiding preventative medicine and mitigating upstream contributors to the disease processes that bring people to the ED. If these research tools are applied well, we can hope to reduce ED utilization and overall disease burden in our communities.

References

  • Kraaijvanger N, van Leeuwen H, Rijpsma D, Edwards M. Motives for self-referral to the emergency department: a systematic review of the literature. BMC Health Serv Res. 2016 Dec 9;16(1):685. doi: 10.1186/ s12913-016-1935-z. PMID: 27938366; PMCID: PMC5148909.
  • Vanstone NA, Belanger P, Moore K, Caudle JM. Socioeconomic composition of low-acuity emergency department users in Ontario. Can Fam Physician. 2014 Apr;60(4):355-62. PMID: 24733328; PMCID: PMC4046549.
  • Breena R. Taira, Public Health Interventions in the Emergency Department: One Resident’s Perspective, Annals of Emergency Medicine, Volume 61, Issue 3, 2013, Pages 326-329, ISSN 0196-0644, https://doi.org/10.1016/j.annemergmed.2012.08.029.
  • Casey JA, Schwartz BS, Stewart WF, Adler NE. Using Electronic Health Records for Population Health Research: A Review of Methods and Applications. Annu Rev Public Health. 2016;37:61-81. doi: 10.1146/annurev-publhealth-032315-021353. Epub 2015 Dec 11. PMID: 26667605; PMCID: PMC6724703.
  • Social Vulnerability Index. https://www.atsdr.cdc.gov/placeandhealth/svi/index.html
  • Area Deprivation Index. https://www.neighborhoodatlas.medicine.wisc.edu/ 7.RPD Open Data Portal. “Rochester, NY Shooting Victims” Accessed April 7, 2024. https://data-rpdny.opendata.arcgis.com/pages/shooting-victims
  • The emergency department—a laboratory for public health, Yale Medicine Magazine, 2013 – Spring

Figure 1: Social Vulnerability Index mapped across New York state at the county level.

Figure 2: Area Deprivation Index national percentiles mapped across New York state at the level of Census Block Group.

Figure 3: Heat Map of fatal shootings 2020-2023 across Rochester, New York, overlayed on top of SVI in local neighborhoods. Figure generated using ArcGIS.